Forex Chart Analysis AI for Technical Trade Setups
Forex Chart Analysis AI for Technical Trade Setups
Chart analysis is the foundation of technical trading. Traders use candlestick patterns, support and resistance levels, and technical indicators to identify potential entry and exit points.
Manual chart analysis requires scanning multiple timeframes, calculating dozens of indicators, and interpreting complex patterns. An ai chart analysis forex tool automates much of this work, providing insights while you maintain control of your decisions. This type of forex chart reader ai processes data that would take hours to review manually.
ForexGPT's ai technical chart analysis reads technical patterns across 5+ timeframes, calculates 20+ indicators, and presents findings in an easy-to-interpret format. Let's explore how AI enhances chart analysis and how ForexGPT delivers this capability.
How AI Reads Forex Charts
AI chart analysis involves several components that work together to interpret market data.
What Chart Analysis Involves
Traditional chart analysis requires:
- Candlestick pattern recognition: Identifying formations like dojis, hammers, engulfing patterns
- Support and resistance identification: Finding key price levels where reactions occur
- Trend line drawing: Connecting swing highs and lows
- Indicator calculation: Computing RSI, MACD, moving averages, and more AI automates these tasks while providing context about their significance.
How AI Processes Charts
ForexGPT's chart analysis AI works through several stages:
- Data ingestion: Chart data is pulled from OANDA in real-time
- Indicator calculation: All 20+ technical indicators are computed
- Pattern recognition: AI identifies chart patterns across timeframes
- Level detection: Support, resistance, and trend lines are identified
- Signal synthesis: All findings are combined into a comprehensive analysis
This process happens in seconds, covering data that would take a trader minutes to analyze manually.
What AI Can and Cannot Do
AI can:
- Calculate dozens of indicators instantly
- Scan multiple timeframes simultaneously
- Identify common chart patterns
- Detect support/resistance levels
- Measure pattern statistics
AI cannot:
- Predict future price movements with certainty
- Account for unexpected news events
- Understand fundamental market drivers
- Replace human judgment about market context
Automated chart analysis forex is a tool to augment your analysis, not replace it.
ForexGPT's Chart Analysis Tools
ForexGPT provides several tools for chart analysis, from quick scans to deep dives.
The get_chart_data Tool
This tool retrieves detailed chart information:
- Candlestick data: Open, high, low, close prices
- Technical indicators: All 20+ indicators pre-calculated
- Support/resistance levels: Automatically identified key levels
- Trend lines: Drawing lines connecting swing points
The analyze_asset Tool
For comprehensive analysis, analyze_asset combines:
- Chart data: Full candlestick and indicator information
- Pattern recognition: Identified chart patterns
- Multi-timeframe context: Analysis across 5+ timeframes
- Sentiment scoring: AI interpretation of the chart data
- Trade setup recommendations: Suggested entry, stop, target
Interactive Chart Widget
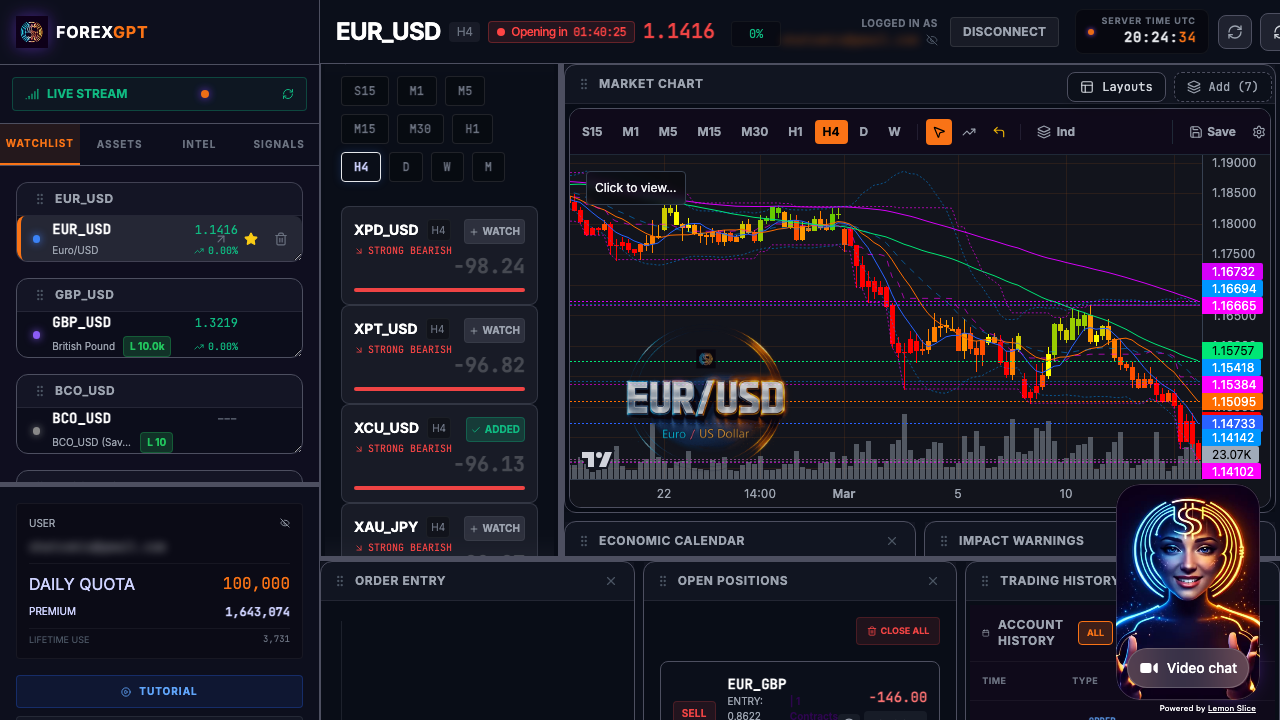
In the Pro Terminal, charts are fully interactive:
- Multiple chart types: Candlestick, bar, line, Heikin-Ashi
- Custom indicators: Add your preferred indicator configurations
- Drawing tools: Add trendlines, support/resistance, Fibonacci
- Timeframe switching: Instantly switch between timeframes
- Widget integration: Analysis results displayed alongside charts
Multi-Timeframe Analysis
Checking multiple timeframes is critical for accurate analysis:
- Daily chart: Identifies the primary trend
- 4-hour chart: Shows intermediate momentum
- 1-hour chart: Reveals short-term structure
- 15-minute chart: Shows immediate price action
ForexGPT's analyze_timeframes tool provides all four simultaneously, showing how signals align or conflict.
How Traders Use Chart Analysis: A Step-by-Step Workflow
Effective chart analysis follows a systematic process that helps traders make confident decisions.
Step 1: Select the Pair
Choose which currency pair to analyze based on your watchlist or market scanner results:
- Start with scanner results: Use the market scanner to find active setups
- Filter by criteria: Select pairs with strong Sentiment Scores (above +70 or below -70)
- Add to analysis queue: Focus on 3-5 pairs for detailed analysis
Step 2: Review the Chart
Examine the price action on the primary timeframe:
- Check trend direction: Is price making higher highs/lows or lower highs/lows?
- Identify support/resistance: Look for recent reaction levels
- Assess volatility: Is price moving in a range or trending?
Step 3: Check Technical Indicators
Review the AI-calculated indicators to confirm your observations:
- Trend indicators: Check moving averages, MACD, and ADX
- Momentum oscillators: Review RSI, Stochastics for overbought/oversold
- Volatility indicators: Check ATR and Bollinger Band width for volatility context
Step 4: Identify Patterns
Let the AI highlight chart patterns you might miss:
- Review identified patterns: Focus on well-defined formations
- Check pattern type: Flags, wedges, head and shoulders, etc.
- Measure pattern statistics: Review historical reliability scores
Step 5: Make Your Decision
Combine all analysis to determine your trade action:
- Synthesize findings: Does the technical picture align?
- Determine entry point: Use support/resistance or pattern targets
- Set stop-loss and take-profit: Use ATR for realistic targets
- Review multi-timeframe: Ensure higher timeframe alignment
Multi-Timeframe Chart Analysis
Using multiple timeframes provides context that single-timeframe analysis misses.
Why Multiple Timeframes Matter
A trade setup that looks valid on a 15-minute chart might be against the daily trend. Checking multiple timeframes helps:
- Confirm primary direction: Daily trend should guide trade decisions
- Identify optimal entry: Shorter timeframes show precise entry points
- Avoid false signals: Setup across timeframes is more reliable
- Set realistic targets: Multi-timeframe alignment suggests stronger moves
The Analysis Workflow
- Start with daily: Identify primary trend direction
- Check 4-hour: Confirm intermediate momentum
- Review 1-hour: Look for short-term patterns
- Use 15-minute: Pinpoint entry/exit levels
- Execute: Trade only if timeframes align
Identifying Timeframe Alignment
Strong signals occur when:
- All timeframes show the same direction
- Moving averages align (shorter MA above longer MA on all timeframes)
- RSI is in same zone (overbought/oversold) across timeframes
Caution signals occur when:
- Daily trend opposes shorter-term signals
- Multiple timeframes show conflicting patterns
- Indicators diverge across timeframes
analyze_timeframes in Action
The analyze_timeframes tool:
- Shows bullish/bearish/neutral on each timeframe
- Displays indicator values side-by-side
- Highlights alignment or conflicts
- Provides Sentiment Scores for each timeframe
Limitations of AI Chart Analysis
AI chart analysis has valuable strengths but important limitations.
Market Context Matters
Charts show price action but not why prices are moving. AI cannot:
- Interpret central bank policy decisions
- Analyze economic data releases
- Understand geopolitical developments
- Gauge market sentiment shifts
Always consider fundamental context alongside technical analysis. The AI forex trading assistant provides broader market context, while the sentiment analysis tool adds technical sentiment scoring. For deeper technical workflows, explore our technical analysis AI guide and forex analysis software overview.
AI Identifies Patterns, Not Certainties
AI identifies patterns that have historically led to certain outcomes. But:
- Past patterns don't guarantee future results
- Markets change; pattern reliability shifts
- New patterns emerge as market structure changes
Use AI patterns as probabilities, not certainties.
The Human-in-the-Loop Approach
The most effective approach combines AI with human judgment:
- AI identifies patterns: Scan for setups across timeframes
- Human review: Check if context makes sense
- Risk assessment: Apply your risk management rules
- Trade decision: You approve or reject
FAQ
What is forex chart analysis AI?
Forex chart analysis AI automates the reading of technical charts by calculating indicators, identifying patterns, and analyzing multiple timeframes simultaneously. It augments your analysis, not replaces it.
How many technical indicators does ForexGPT calculate?
ForexGPT calculates 20+ technical indicators including RSI, MACD, moving averages, Bollinger Bands, Fibonacci levels, stochastics, and more.
Can AI identify support and resistance?
Yes. ForexGPT's AI automatically identifies support and resistance levels based on historical price reactions and psychological price points.
Does ForexGPT analyze multiple timeframes?
Yes. We analyze 5+ timeframes simultaneously and show how signals align or conflict across the daily, 4-hour, 1-hour, and 15-minute charts.
Is chart analysis available for all assets?
Yes. Chart analysis is available for all 127+ assets including forex pairs, crypto, indices, and commodities.
What chart types does ForexGPT support?
We support candlestick, bar, line, and Heikin-Ashi chart types. You can also add custom technical indicators and drawing tools.
How accurate is pattern recognition?
Our AI identifies common chart formations as part of the broader analysis. Remember, patterns indicate probabilities, not certainties. Always verify with your own chart review.
Can I customize the indicators shown on charts?
Yes. In the Pro Terminal, you can add custom indicator configurations, adjust period settings, and save your favorite indicator layouts for quick access.
How do I interpret conflicting signals across timeframes?
Conflicting signals across timeframes often indicate a potential reversal or market indecision. Look for alignment on higher timeframes (daily, 4-hour) to determine the primary trend. If signals conflict, it may be best to wait for clearer alignment before entering.
What's the best timeframe for chart analysis?
For day trading, use 15-minute and 1-hour charts with daily and 4-hour as context. For swing trading, focus on 4-hour and daily charts. For position trading, focus on daily and weekly charts.
Can AI draw trend lines automatically?
Yes. Our AI automatically identifies and draws trend lines connecting swing highs and lows. You can also manually add, adjust, or delete trend lines in the Pro Terminal.
How do I use Fibonacci levels in my analysis?
Fibonacci levels help identify potential support, resistance, and target zones. Our AI calculates key Fibonacci retracement and extension levels. Use them in conjunction with price action around previous swing points.
What chart patterns does ForexGPT recognize?
We recognize common patterns including head and shoulders, double tops/bottoms, triangles, flags, wedges, and various candlestick formations like dojis, hammers, and engulfing patterns.
About the Author
This article was written by the ForexGPT team, led by Steven Hatzakis—a financial services industry expert with over 20 years of experience in forex and fintech. For a deeper look at the platform architecture and methodology, read the ForexGPT White Paper. For his latest research on AI-driven trading systems, see Steven's paper on Protocol-Constrained Agentic Systems. Explore all guides and tools on the Learn resource hub.
This content was created with AI assistance, reviewed for accuracy by the ForexGPT team, and is updated regularly to reflect current platform capabilities.
Important Disclaimer
ForexGPT is a market analysis tool, not a financial advisor. All content on this page is for informational and educational purposes only. It does not constitute investment advice, financial advice, or trading advice.
Trading forex and other financial instruments involves substantial risk of loss and is not suitable for all investors. Past performance of any analysis tool or signal does not guarantee future results. You should carefully consider your investment objectives, level of experience, and risk appetite before trading.
ForexGPT does not guarantee the accuracy, completeness, or timeliness of any analysis or signal generated by its tools. Always conduct your own research and consult with a qualified financial advisor before making trading decisions.
Start Analyzing Charts - Try ForexGPT Free Today